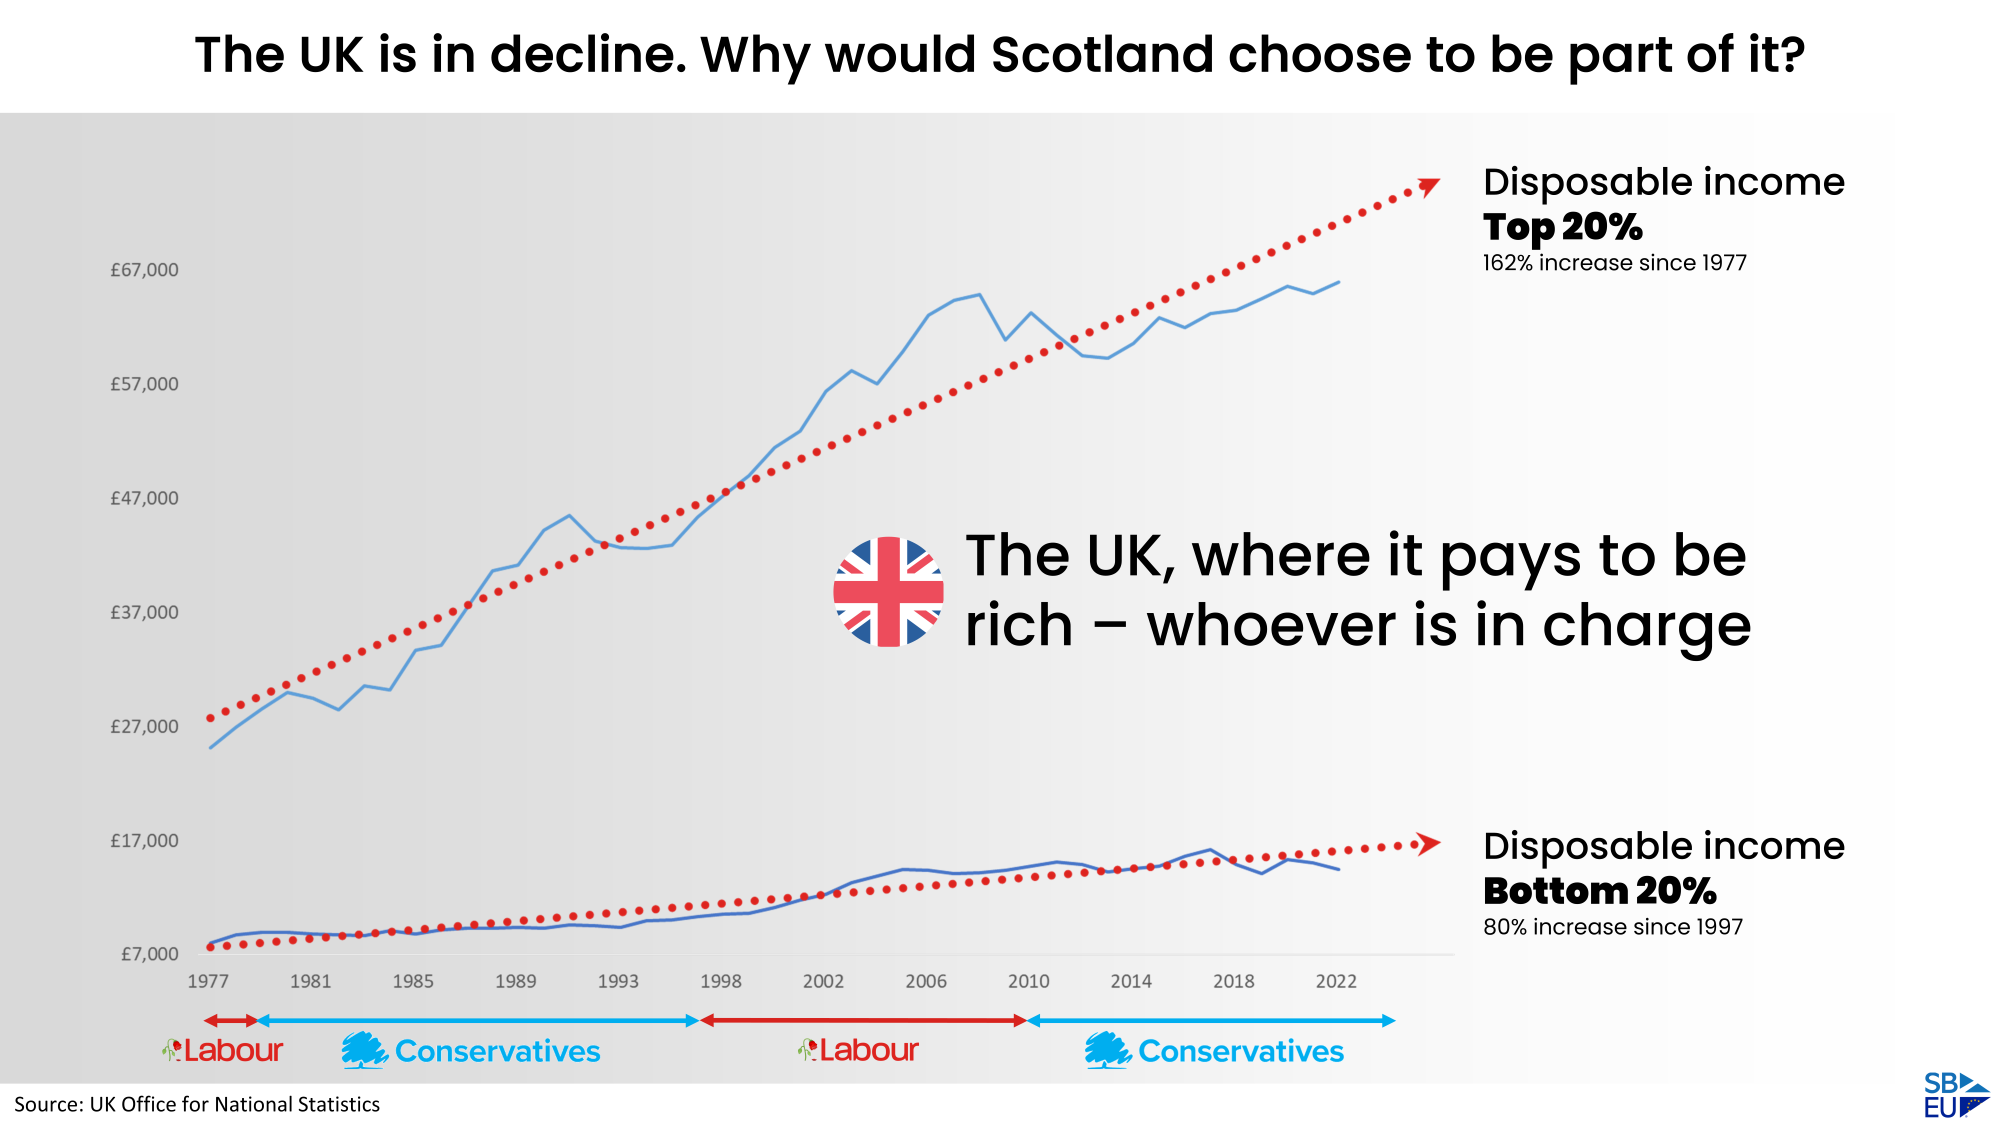
The top 20% in the UK have seen a big rise in disposable incomes over the past few decades. The bottom 20% haven’t been so lucky. The UK: where it pays to be rich.
Since 1977 the top 20% have seen their disposable incomes rise by 162% – whilst in the same time period the bottom 20% saw theirs rise by half this percentage. And whichever unionist party is having its turn at power – whether 🥀Labour or Tory – this trend doesn’t change.
To understand what this means, consider the Real Living Wage. For the past few years this has been calculated by the Living Wage Foundation. The Real Living Wage is the only UK wage rate based on the cost of living.
To convert the Real Living Wage to an equivalent disposable equivalent for each year we used The Salary Calculator.
The bottom 20% have always had a disposable income lower than the Real Living Wage. Currently the Real Living Wage (excluding London) equates to a net income some 29% higher than that received by the bottom 20%.
So not only does the UK provide below-minimum cost of living income for many households, but this trend is a long term one that is set to continue.

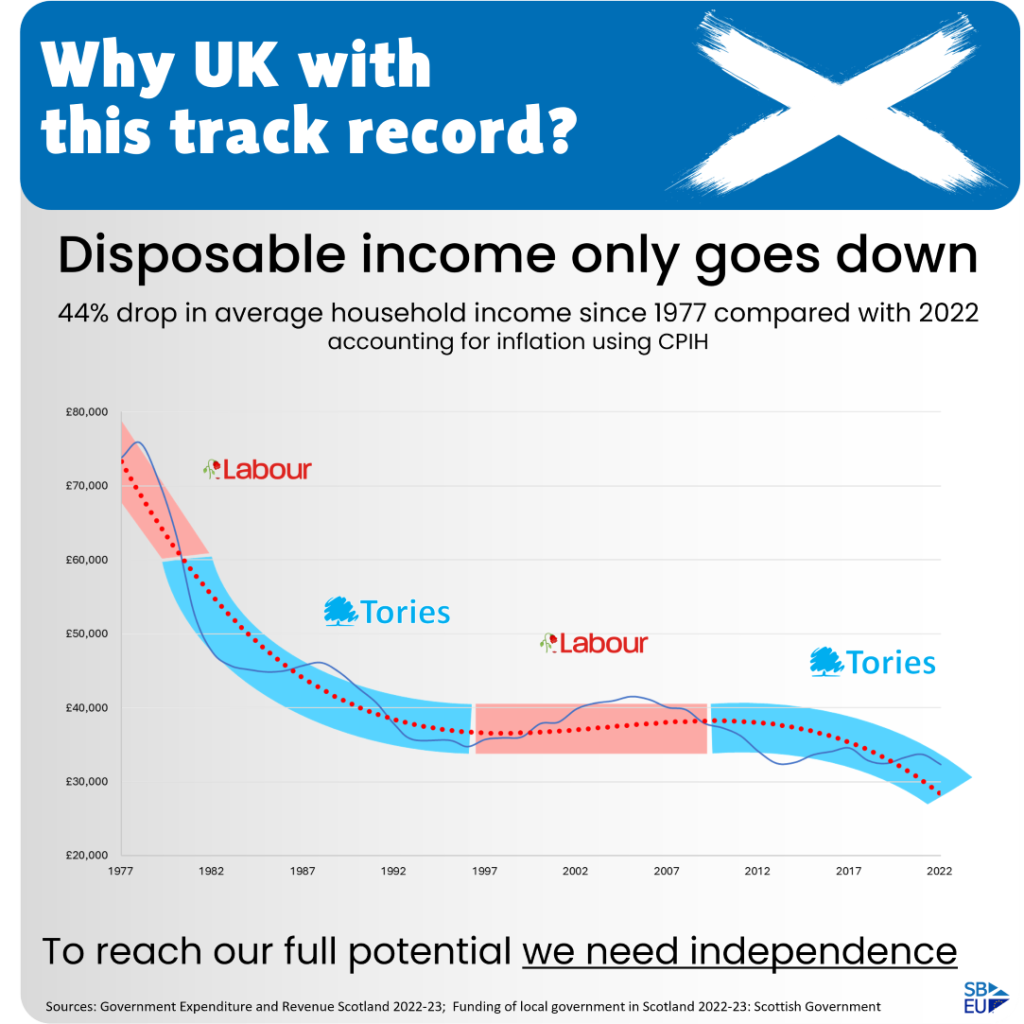
The average household income in 2022 is equivalent to over £70,000 in 1977 when we account for inflation over that period. It’s clear that average household income has failed dramatically in keeping up with inflation!
Sources

Leave a Reply